February 23, 2026
February 23, 2026
A little universe, just for you
Free PNG · 1080 × 1350 · No account needed
Image rights and credit requirements apply when sharing or reusing imagery.
Your celebration date stays the same. Each image keeps its actual publication date.
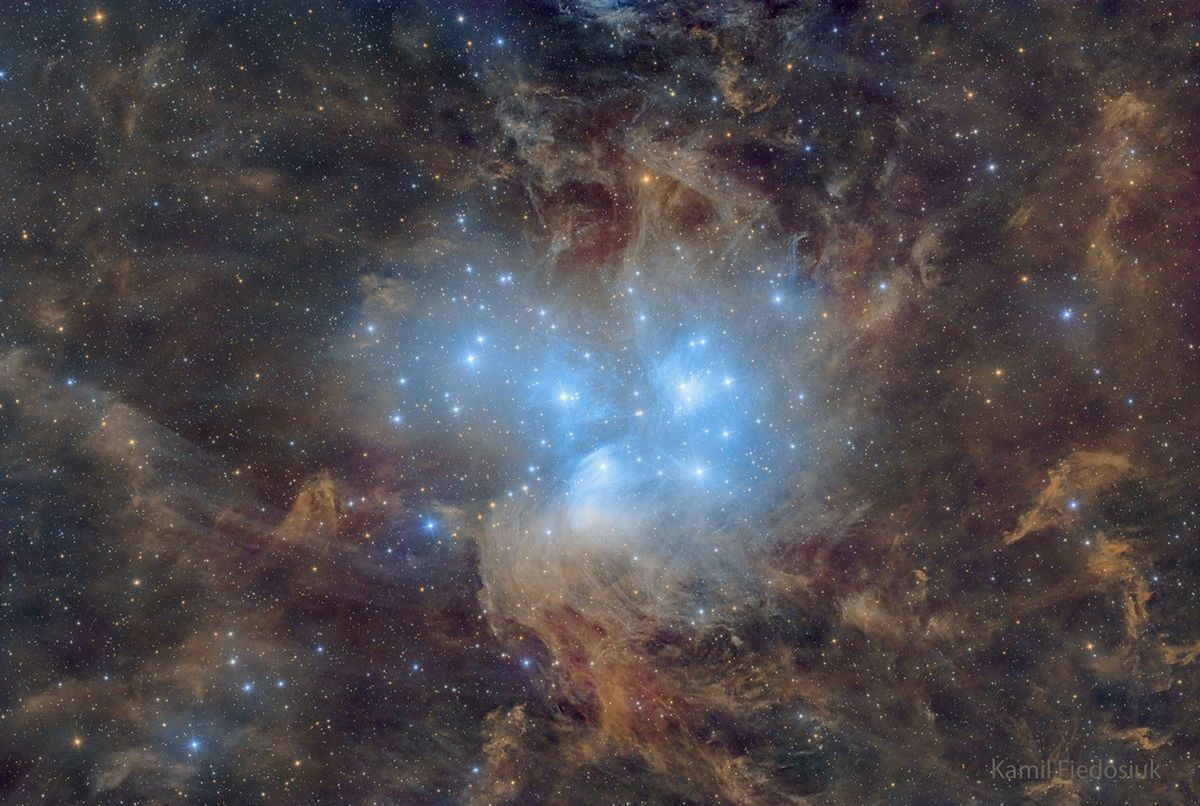
Selected image source ↗ APOD published February 23, 2026. Credit: Kamil Fiedosiuk. A publication-date match, not a photo taken on your date. Independent of NASA.
Behind the original result
Read the original APOD for the astronomer’s explanation and full image credits. Its text is preserved in the archive as published.
Have you ever seen the Pleiades star cluster? Even if you have, you probably have never seen it as large and clear as this. Perhaps the most famous star cluster on the sky, the bright stars of the Pleiades can be seen with the unaided eye even from the depths of a light-polluted city. With a long exposure from a dark location, though, the dust cloud surrounding the Pleiades star cluster becomes very evident. The featured 18-hour exposure, taken from Bory Tucholskie, Poland covers a sky area several times the size of the full moon. Also known as the Seven Sisters and M45, the Pleiades lies about 400 light years away toward the constellation of the Bull (Taurus). A common legend with a modern twist is that one of the brighter stars faded since the cluster was named, leaving only six of the sister stars visible to the unaided eye. The actual number of Pleiades stars visible, however, may be more or less than seven, depending on the darkness of the surrounding sky and the clarity of the observer's eyesight. Sky Surprise: What picture did APOD feature on your birthday? (after 1995)
Image credit: Kamil Fiedosiuk
Updated · APOD entries through